


Making a Gantt chart in Google Sheets helps manage projects. Plus, it allows for easy planning and careful management of tasks. You start by entering your data into a Gantt chart template. This comprises the following things-
- Project tasks
- How long do they take?
- When do they need to be done?
One of the amazing things about the Gantt chart is that it assists in scheduling along with tracking the project. It also shows how the project is progressing.
Google Sheets can be used to create your Gantt chart. It can store project timelines well and visually show your project timeline.
Introduction to Gantt Charts
It’s a fact that a Gantt chart is used a lot for planning, scheduling, and tracking projects.
These charts give a clear picture of how the project is progressing and the data from the spreadsheet. The stunning thing is that they help in making decisions ahead of time and make certain projects stay on track. They can be used to see how project tasks depend on each other and adjust schedules as needed.
What is a Gantt Chart?
A Gantt chart is a visual tool used in project management that helps in planning and tracking the project. It’s a kind of bar chart that shows a project timeline. To add on, it shows project tasks on the vertical axis and how long they take on the horizontal axis. They are used a lot in scheduling projects to figure out when they need to be done as well as help in managing tasks.

One amazing feature of the Gantt chart is that a Gantt chart template can often take spreadsheet data and turn it into a visual that’s easy to understand. It’s just fascinating how a Gantt chart gives a full view of the project’s progress, timelines, and overall status!
Why use a Gantt Chart?
There is no denying that a Gantt chart is a key tool in project management used for planning and scheduling. With a Gantt chart template, you can manage project tasks well. The data from the spreadsheet is shown in an organized way allowing for efficient project tracking.
Gantt charts are useful in managing project timelines. Note that they help in setting and meeting project deadlines too. In short, the Gantt chart aids in managing the project effectively.
Step-by-step guide to streamline workflow in Bonsai
To streamline workflow in Bonsai is an intuitive process that enhances project management by providing a visual timeline of tasks and milestones.
Here's a step-by-step guide to help you get started:
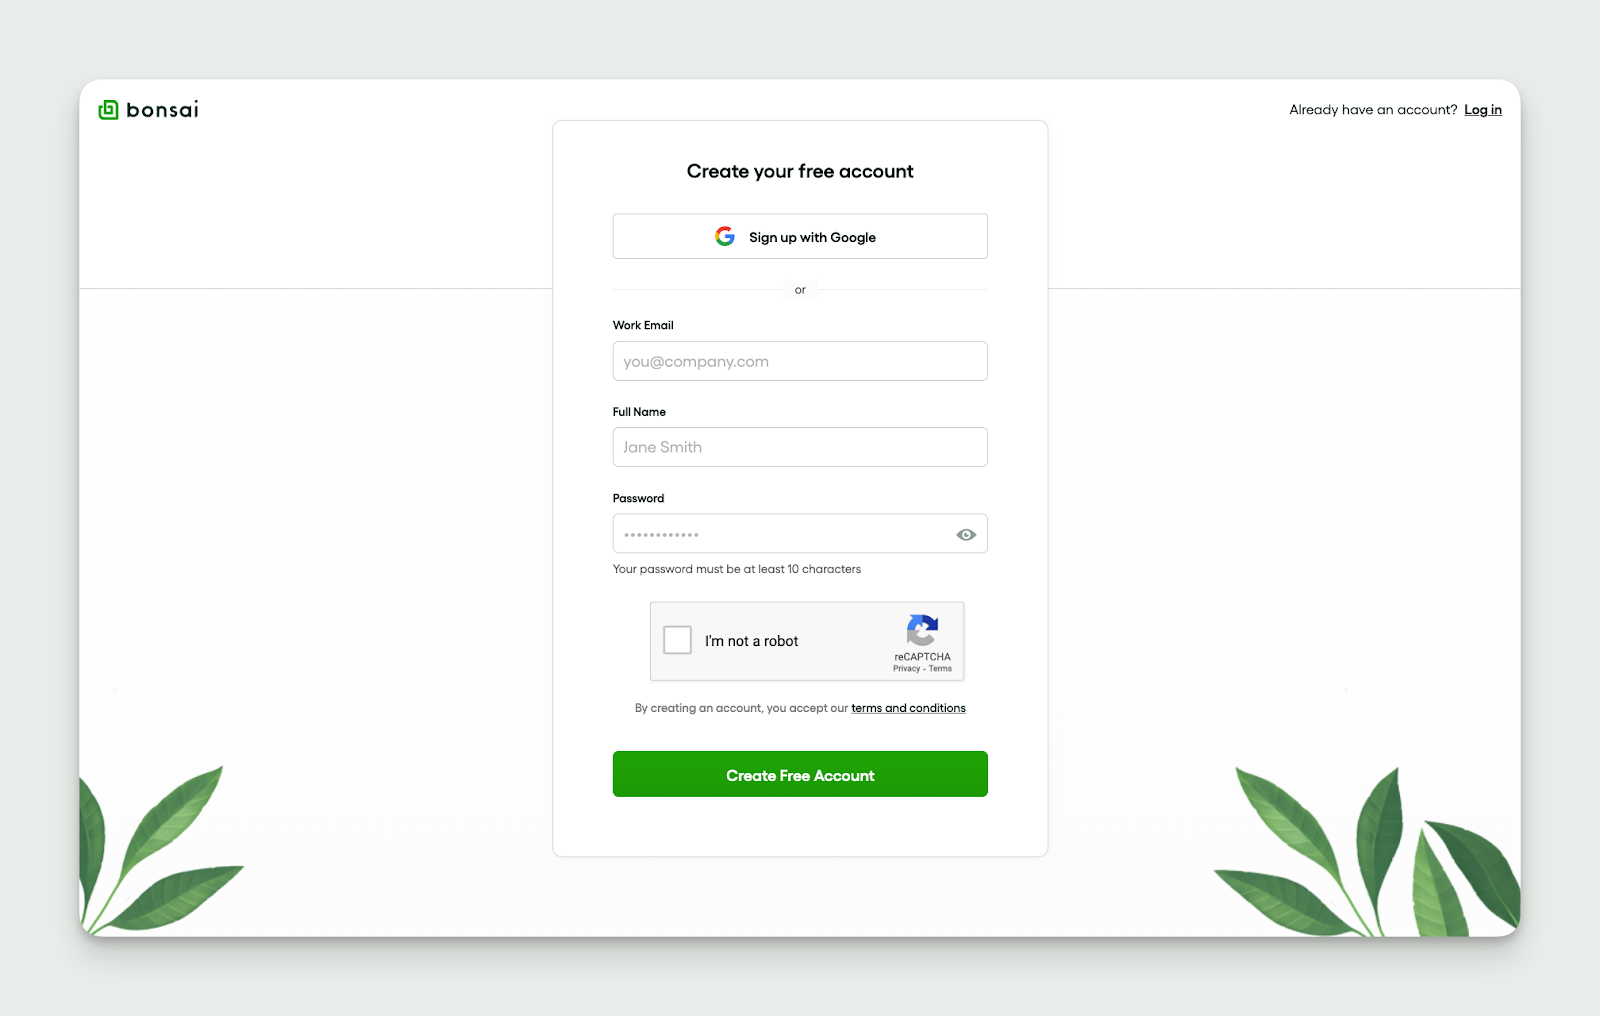
1. Sign in to Bonsai
- Access your Bonsai account, or sign up if you're a new user.
- Navigate to the 'Projects' section and create a new project.
2. Define project details
- Enter your project's name, description, and set the start and end dates.
- Click on the 'Tasks' tab to add individual tasks, assign them to team members, and set deadlines.
3. Collaborate with your team
- Share with team members for real-time collaboration.
- Adjust as Needed: Use diagrams to visualize project phases, ensuring everyone understands their tasks and deadlines.
4. Review and Report
- Utilize Bonsai's reporting features to analyze the project's progress and share insights with stakeholders.
- By following these steps, you can leverage Bonsai's robust features that keeps your project on track and clearly communicates the plan to your team.

Understanding Google Sheets
It’s well known that Google Sheets is a versatile tool used a lot for managing and planning projects that can store and organize spreadsheet data. One of the best parts of Google Sheets is that it makes managing tasks and tracking projects straightforward. It helps you meet project deadlines efficiently too.
Furthermore, Google Sheets provides many project templates to make the process of creating charts easier.
What is Google Sheets?
Google Sheets is an online app that lets users make, change, and store spreadsheet data. It has some amazing features like the following-
- Making charts
- Project timelines
- Project templates

Google Sheets has Gantt chart templates for scheduling projects. This makes it easier to track how long tasks take and watch project deadlines. The cool thing about Google Sheets is that its easy-to-use interface and features for working together make it a popular choice.
Benefits of using Google Sheets for Gantt Charts
Google Sheets is a good platform for making Gantt chart templates for managing projects well. The astonishing thing is that you can put spreadsheet data directly into the chart. This makes managing tasks simpler, making projects smoother, etc.
Project timelines, how long tasks take, and project deadlines are shown visually. As a positive outcome of that, it improves project scheduling and tracking. Seeing the project's progress makes it easy to spot delays or progress in making the chart. This leads to a more complete project timeline.
Preparing to create a Gantt Chart in Google Sheets
There is no denying that making a Gantt chart using Google Sheets is a great way to manage projects. It’s good for managing tasks and planning projects. Plus, it aids in scheduling projects and setting your project timelines right. The cool thing is that this makes certain you meet your project deadlines well. You start with the Gantt chart template. You put your spreadsheet data into it, detailing project tasks and how long they take.
Making the chart easily gives a reliable view of project progress. The good news is that it improves your attempts to track the project. Remember, once set up, a Gantt chart in Google Sheets becomes one of your most useful project templates.
Setting up your Google Sheets
To start planning your project, Google Sheets offers many project templates. Note that you can use a Gantt chart template to see the project’s progress. This includes how long tasks take as well as project timelines. The stunning thing is that with the very efficient spreadsheet data, you can easily track project tasks, and overall project tracking.
Moreover, setting up Google Sheets for project management makes the process much simpler. One of the amazing benefits of this platform is that it lets you create a customizable and interactive project schedule. This lets you record and monitor tasks in real time aiding in managing tasks. These features, along with a handy tool for making charts, allow for better visualization of project progress.
Understanding the basic structure of a Gantt Chart
At its simplest, a Gantt chart is a kind of bar chart that shows a project schedule by tracking and managing the project. It works by showing project tasks along with how long they take and when they happen. It’s interesting to find out that this tool is very useful in planning projects as it provides clear project deadlines.
Making a Gantt chart comprises utilizing a Gantt chart template. You put spreadsheet data into it about the tasks, start and end dates, along with their duration. The stunning thing about making this chart is that it lets project managers easily track and change their project timelines and scheduling strategies.
Step-by-step guide to creating a Gantt Chart in Google Sheets
To make a Gantt chart in Google Sheets, you start a project management spreadsheet for managing tasks and tracking projects.
Then, open Google Sheets and pick a Gantt chart template from the project templates. Don’t forget to put your project tasks, how long they take, etc. into the ready spreadsheet columns.
It’s just fascinating to find out how making the Gantt chart gives a visual picture of your project schedule.
Step 1: Inputting your project data
The first step in managing a project well is to put your project data in a Gantt chart template. This comprises the following things:
- A detailed list of project tasks
- How long do they take?
- Project deadlines
You should be aware of the fact that you need to have a detailed project planning document with all your spreadsheet data.
Project timelines, scheduling, and managing tasks are key parts of this step. The goal is to have a strong base for tracking the project and seeing the project progress through making the chart.
Step 2: Creating a stacked bar chart
Once you have your spreadsheet data organized in a Gantt chart template, you can start to make a stacked bar chart for better task management. Remember that this is a significant step in managing a project because it makes tracking the project simpler. Here are a few key points:
- Project Planning: The chart should clearly show project timelines and deadlines.
- Task Management: A visual picture of project tasks helps in understanding the time given to each task.
- Project Scheduling: With the help of this chart, scheduling and tracking the project becomes intuitive. This step is important for a smooth flow of the project timeline. The reason for this is that it makes a complex project much more understandable.
Step 3: Adjusting the Chart to display as a Gantt Chart
Once you’ve put your project details into your spreadsheet data, the good news is that now you can go on to adjust your graph to look like a Gantt chart template. This is a key phase in managing a project and assists with scheduling the project and managing tasks. Just extend horizontal bars across the timeline to show how long tasks take.
The beauty of using a Gantt chart for planning a project is in its ability to allow tracking of the project over time. Given project tasks and project timelines can always change, the stunning thing about this chart is that it gives a clear visual picture of the project's progress.
It’s no secret that making the Gantt chart is a very effective tool for managing project timelines. With just a quick look, project templates can be adjusted according to changes.
Step 4: Customizing your Gantt Chart
Once you have outlined all the necessary parts of your project on a Gantt chart template, it is now time to customize it for your project’s specific needs. This step is vital in making sure project planning and project scheduling are efficient.
With the chart made, you can start putting in your project tasks, and project deadlines to make a clear project timeline. The cool thing is that just by doing this, you can easily track progress and make adjustments as needed.
Advanced tips for Gantt Charts in Google Sheets
The beauty of using a Gantt chart is that it can make managing tasks and scheduling projects simpler. At the same time, they provide a better view of project progress. You can customize the spreadsheet data with conditional formatting to highlight specific tasks or deadlines.
The good news is that you can make your Gantt chart do more by linking cells. This can update how long tasks take or project timelines dynamically. Also, using project tracking methods with automatic update functions in Google Sheets can give real-time updates on project templates.
Using conditional formatting for better visualization
It’s well known that conditional formatting is a flexible tool for managing projects, especially when used with a Gantt chart template. This method helps improve project planning through a more effective view of spreadsheet data. This allows for the following stunning results:
- More accurate task duration
- Project scheduling
- Tracking
Using conditional formatting in project scheduling helps in seeing task progression, and meeting project deadlines. It greatly improves the following things:
- Project tracking
- Understanding project templates
- Making charts for visualizing project progress
Adding dependencies to your Gantt Chart
Know that the step of adding dependencies to your Gantt chart template is a key stage in planning a project. It’s a fact that dependencies determine the order of tasks and the project timeline. This plays a vital role in managing a project as it helps in allocating resources.
The spreadsheet data collected is used in creating dependencies in a Gantt chart. This boosts the understanding of task duration, project scheduling, etc. As a positive outcome of that, it enhances the visualization of project progress.
Alternatives to Google Sheets for Gantt Charts
It’s well known that Microsoft Excel and Project Central are two great alternatives to Google Sheets for making Gantt charts. The astonishing thing about Excel is that it offers a strong Gantt chart template and a wide range of tools to customize your project planning. You can change spreadsheet data, and task duration to suit your needs.
On the other hand, Project Central is specifically designed for managing projects. It provides capabilities to handle project tasks, project deadlines, project scheduling, and more.
Bonsai: a comprehensive tool for client management
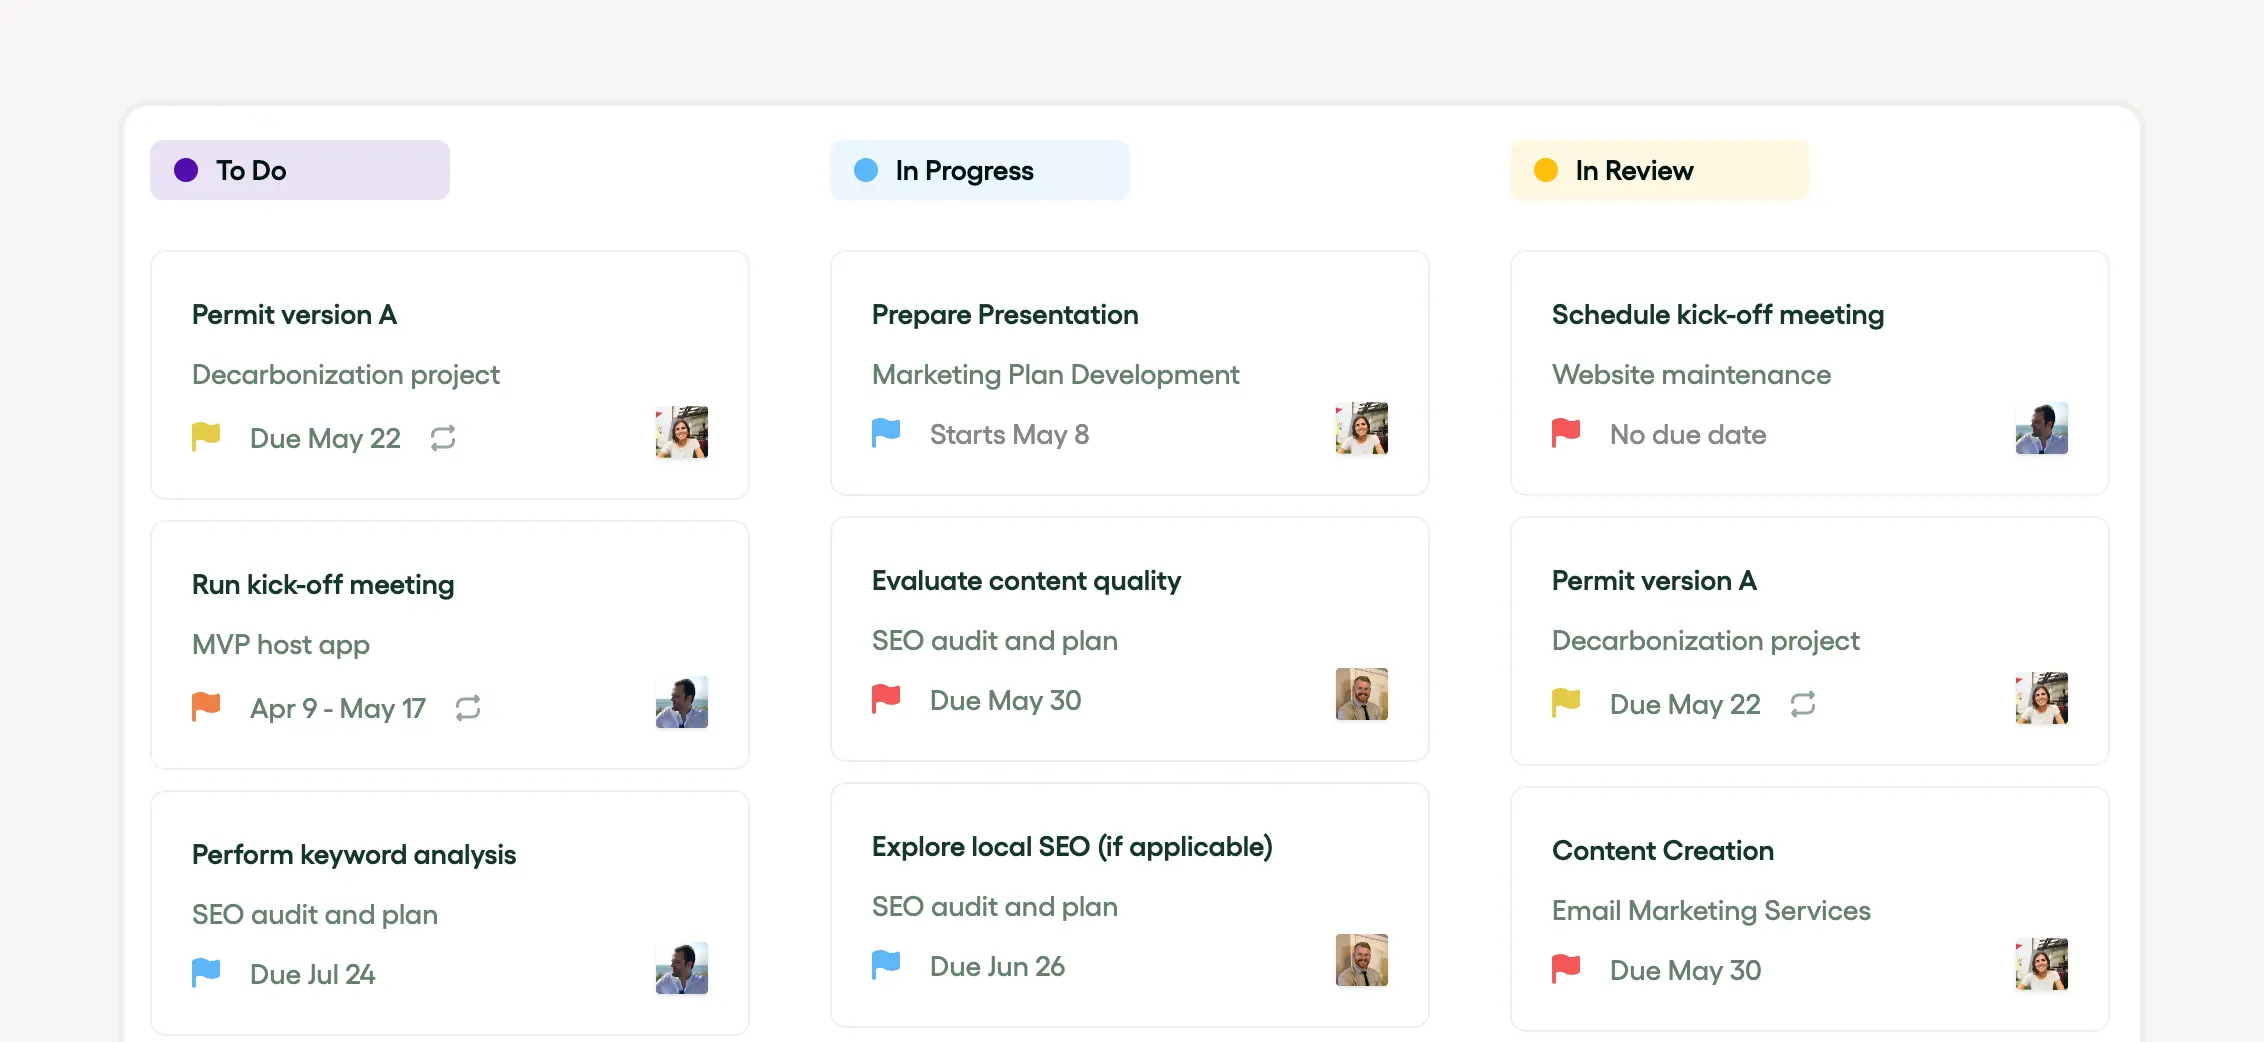
Bonsai is a comprehensive client management tool designed to streamline business operations for professional service providers, agencies, and small businesses. It consolidates various aspects of business management into one integrated platform, making it easier to organize projects, manage clients, and collaborate with teams.
.webp)
With Bonsai, users can handle client management, project management, financial management, and even use CRM and scheduling features. It supports task tracking, time tracking, budgeting, and provides timesheets and detailed finance reports. The platform also offers a client portal, proposals, contracts, invoicing, payments, and expense tracking, all aimed at simplifying the workflow and enhancing productivity.
It stands out for its user-friendly interface and the ability to automate workflows, which saves valuable time. By integrating with other tools, Bonsai ensures a seamless operation, allowing businesses to focus on delivering quality work and growing their client base.
Microsoft Excel: A familiar alternative
For people and organizations familiar with Microsoft Excel, this tool is an excellent alternative for managing projects. The stunning thing about this tool is that by using a Gantt chart template, one can organize spreadsheet data into a visually appealing project timeline. There is no denying that with Excel’s comprehensive project templates, managing tasks becomes much easier.

Excel’s features for scheduling projects let the user set how long tasks take. This improves project planning.
ProjectManager.com: A dedicated project management tool
ProjectManager.com is a complete tool dedicated to managing projects effectively. The beauty of this tool is that it is designed to help in planning, and tracking projects to help you meet your project deadlines. The tool has a Gantt chart template for visualizing project timelines. This makes making charts easy and understanding how long tasks take.

With ProjectManager.com, project tasks are well-defined and manageable, while watching project progress. There is no doubt that for good task management and keeping project timelines, ProjectManager.com is the place to go.
Trello: A visual approach to project management
Trello offers tools for planning projects, managing tasks, along with tracking projects. Its customizable project templates allow for the smooth making of charts, including Gantt chart templates that reflect project timeline structure.

With Trello, scheduling projects is no longer a hard task. The stunning thing about this tool is that tasks can be tracked and changes in project timelines are clearly visible. This makes visualizing project progress easy.
Conclusion
It’s obvious that managing projects and tasks is key for smooth project planning and execution. Tools like a Gantt chart template can greatly simplify project tasks and deadlines. They provide a clear project timeline as well as aid in tracking the project.
Remember, you can easily use spreadsheet data for project scheduling and mapping task durations. This helps in planning the project effectively. Project templates are available for this purpose. Using spreadsheet data and project templates, you can manage your project efficiently and meet your deadlines.
