Making a timeline in Microsoft Excel is easy. It can help manage your project timeline! Just need to put timeline data into a ready-made timeline template. Or make your own timeline from the start.
There are many ways to make more detailed timelines. This includes adding more layers and details. This makes making project timelines easy! For a nice-looking timeline, think about making a project timeline template into a timeline graphic.
Introduction
It is interesting that making a project timeline can make managing and doing complex projects easier. One can choose to change a ready-made timeline template. It can make your timeline from the start. It's important to understand the basics of timeline data.
This guide will show easy ways to make a timeline in Microsoft Excel.
Understanding the importance of timelines for agencies
Knowing that, timelines are important for agencies. They show a project timeline and a clear plan of tasks to be done. Agencies can use a timeline template to easily make a timeline. They can change the timeline to fit the project.
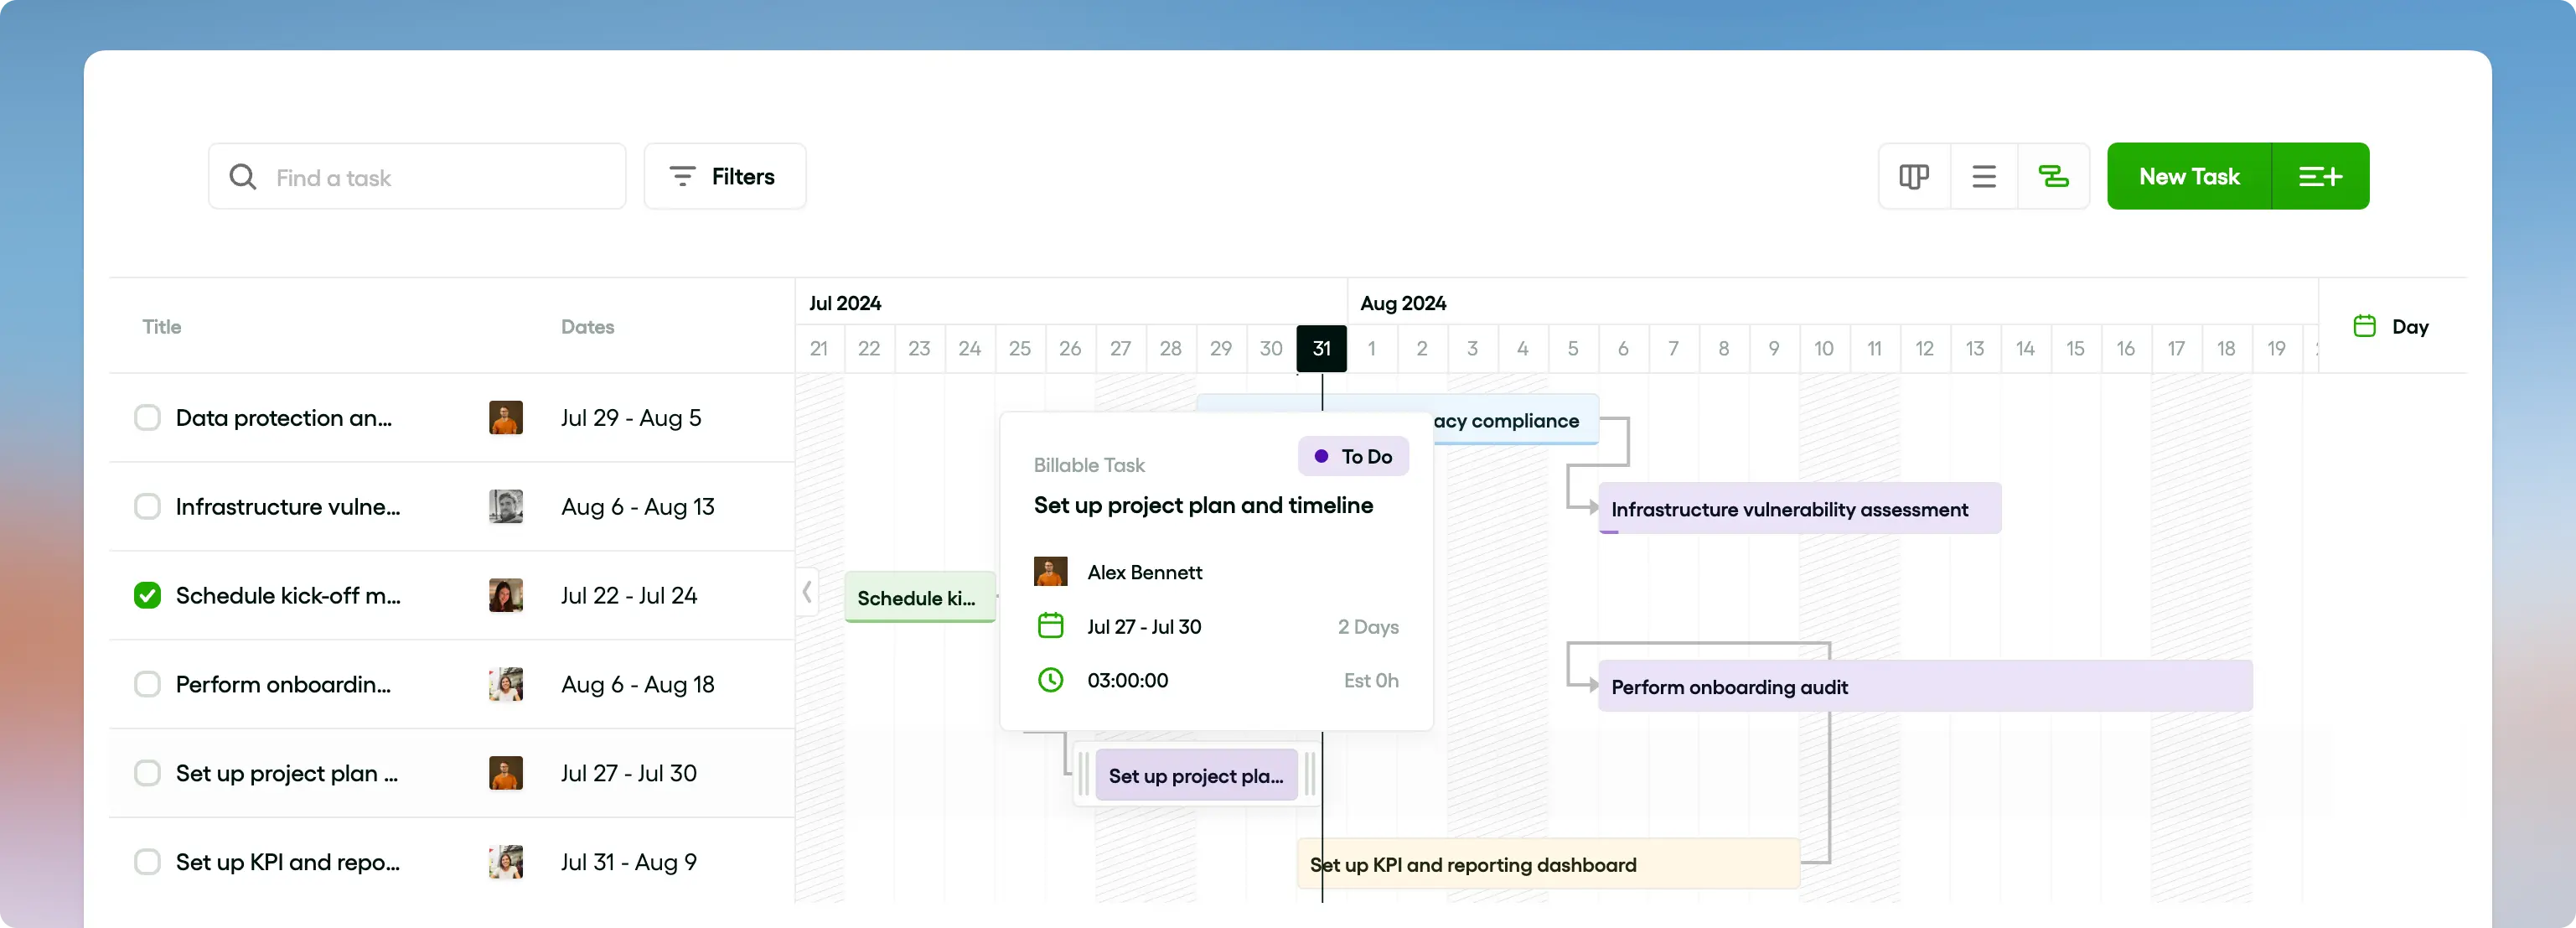
Making your own timeline from scratch can be better. It allows for a more detailed timeline that fits specific project needs. Tools like Microsoft Excel make it easy to create timelines, but you can also use a project management software, that will allow you to quickly view your tasks and track progress, either with a Kanban board or a Gantt chart.
Why choose Excel for creating timelines
Choosing Excel to make a timeline has many benefits. It lets users change timelines to fit their specific project needs. Excel has many timeline templates, features for importing data,etc.
Making project timelines in Excel is easy. Even more detailed timelines can be set up easily. The process to add a timeline, or put in timeline data is user-friendly. This makes Excel one of the easy ways to make a timeline in Microsoft Excel!
Getting started with Excel
Microsoft Excel is a user-friendly program. Plus, it has many features that can be used to make a timeline. Users can make their own timeline or use a ready-made timeline template to design a project timeline.

Excel makes it easy to add a timeline. It allows for more detailed timeline edits. It has options for timeline graphics and easy ways to make a timeline from the start! We will say Excel is a valuable tool for making project timelines. Mastering these tools will give the users an advantage in project management skills.
Understanding Excel interface
The Excel Interface lets users make a timeline. They can change it and make it more detailed if needed. It can all be based on their project timeline. It's an easy way to organize timeline data in a way that's easy to understand.
Users can make their own timeline from scratch or use a premade timeline template. Learning to use the Excel interface makes it much easier to manage and show project timelines visually.
Knowing how to use the Excel interface can make the process easier. This frees up more of your time for other tasks.
Key Excel features for timeline creation
Excel offers many features for making a timeline. You can make a timeline from the start, change a timeline! The project timeline template is specially designed for showing project schedules. This makes project timelines easier and more detailed.
Plus, The spreadsheet software has tools to add a timeline graphic. This can be filled with your timeline data. It adds visual clarity and makes an even more detailed timeline easy to understand. It is surprising that Excel offers an easy way to make your own timeline in Microsoft Excel!
Step-by-step guide to creating a basic timeline in Excel
To make a timeline in Microsoft Excel, users need to organize your data in two columns:
- Dates
- Events.
Then open a new workbook, select "Insert" from the menu. What next? Click on "SmartArt". Choose a timeline graphic that fits your needs. You can enter timeline data manually in each text pane or copy-paste bulk data for convenience.
Excel has many ready-made timeline templates. You can use these if the task is too hard. You can change the timeline as you like.
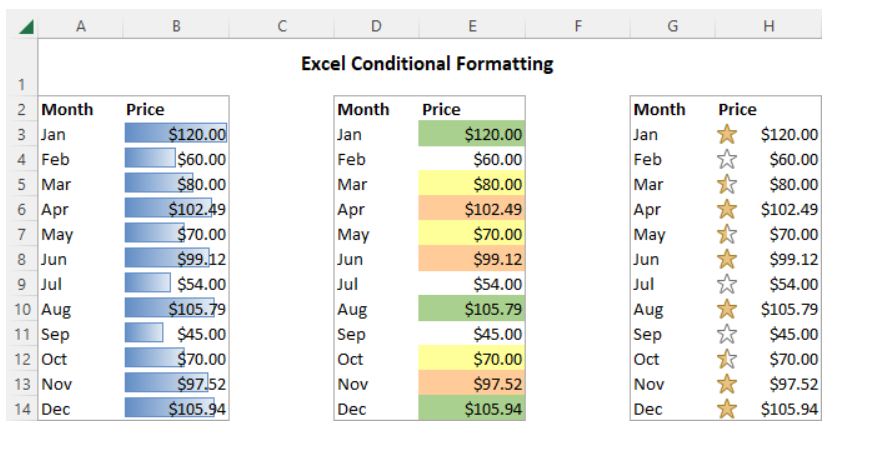
For a more detailed timeline, you need to make a Gantt chart or use conditional formatting. No matter what method you’re using, Excel makes it easy to make your own timeline!
Setting up your Excel spreadsheet
Setting up your Excel spreadsheet to make a timeline is a simple process. And guess what? Start with choosing a premade timeline template or users can make their own timeline from scratch. If you have a more detailed timeline, you can use project timeline templates. You can change timeline templates to fit your needs.
The next step is adding and organizing your timeline data. There are easy ways to make a timeline in Microsoft Excel. Likewise, using Excel's built-in timeline graphic capabilities.
Make sure to make your project timeline in a logical, visually pleasing way. With some practice, users can get better at making timelines in Excel quickly.
Inputting your data
Start by putting timeline data into a project timeline template in Microsoft Excel. Users can either add a timeline to a premade timeline template or start a timeline from scratch. Changing the timeline can turn it into a timeline graphic. This can visually represent information.
For more complex project timelines, it may be necessary to make a timeline in different stages or use multiple templates. There are many easy ways to make timelines that meet your specific needs.
Creating a scatter plot
To make a scatter plot in a project timeline, one needs to have his timeline data ready. Our suggestion to users will be to use Microsoft Excel. They can make their own timeline from scratch or use a ready-made timeline template.
Change the timeline to fit your needs. This might include adding more detailed timeline elements.
Adding a timeline in Microsoft Excel can show your estimates in a visual way. This helps you keep track of the project timeline.
Customizing your timeline
There are many ways to make a timeline for organizing your data. Using an easy-to-use project timeline template can be a good start.
But, making project timelines from scratch for each project can be hard. A ready-made timeline template can be useful in these cases. It’s a faster approach, plus lets you change them as you need.
If users like graphical representation, they could add a timeline graphic. The trick is to choose the most effective method that makes users' presentations clearer.
Creating a project timeline in Excel
Making a project timeline in Excel is easy. Open a new sheet and put in your timeline data. This could include the stages of your project and their respective dates. You can then use the project timeline template built into Excel. Alternatively, users can choose to make their own timeline from scratch!
If one chooses to use a project timeline template, they can easily change it to fit their needs. But, when making more detailed timelines, it may be more useful to start from scratch. It is fascinating that this includes adding and changing timeline graphics as needed!
Understanding project timelines
It’s important to understand project timelines for any project to succeed. They help to see the whole project. You can make a timeline using different tools.
For more detailed timelines, users might want to show the timeline data in a graph to make it easier to understand. Can you imagine you can also make your own timeline from the start!
In short, there are easy ways to make, add, and manage project timelines.
Steps to create a project timeline in Excel
Making a project timeline in Microsoft Excel is a good way to show the different steps of a project. Start by setting up timeline data. This includes the start and end dates for each task or milestone.
Change the timeline template to fit your project’s needs. This includes adding a timeline for each task or phase. Users can change colors and fonts to tell the difference between tasks.
For a more detailed timeline, think about using Excel’s timeline graphic features to add charts or diagrams.
Creating a Gantt chart in Excel
Making a timeline in Microsoft Excel can be very helpful in managing your whole project timeline. It can be a simple timeline data to more detailed timelines that need a detailed project timeline template.
You may be surprised to know that you can use a ready-made timeline template or make your own timeline from the start. Also, timelines can be changed a lot. You can change the timeline graphic to add a timeline for more tasks, and so on.
What is a Gantt chart?
A Gantt Chart is a timeline graphic used to show a project timeline. This visual tool lets you make a timeline and change it to fit your project needs. It’s an easy and efficient way to show the order of tasks and their dependencies over time in a project.

The Gantt Chart might be made from a ready-made timeline template or be made from the start. It depends on how hard the project is. It’s worth noting that software like Microsoft Excel offers tools and aids for making Gantt charts.
How to create a Gantt chart in Excel
To make a Gantt chart in Excel, start by setting up the project timeline data. What next? Start with a timeline template or make your timeline from the start depending on your needs. In the rows, list your tasks with a column for-
- Start date
- End date
- Duration
Add a timeline or a timeline graphic using Excel’s preformatted ‘bar chart.’ Change your timeline, make project timelines visible by highlighting different tasks with colored bars. For more detailed timelines or bigger projects, add milestones, and dependencies.
Advanced Excel timeline tips and tricks
Making a timeline in Microsoft Excel is a good way to track and show project progress. To make your own timeline from scratch, first put your timeline data in a spreadsheet. Label each row with a task and each column with a start date and end date. Use the “Insert” tab to add a timeline graphic
Users can use a ready-made project timeline template. You can change it to fit your project’s needs. This will automatically put your timeline data into a timeline graphic. If your timeline is more detailed, it might be helpful to color-code tasks. You can use different shapes for different types of activities.
Once you know these basic steps, there are many easy ways to make and change your timelines. These could include using shortcuts, macros, or advanced timeline templates. Try different options to see what fits your style and your needs.
Using conditional formatting for better visualization
Have you heard that conditional formatting in Excel is a great way to show your timeline data? This option lets you change timeline graphics by changing the colors or styles based too! It can be very useful when dealing with more detailed timelines with a lot of data.

If you’re making project timelines or need to add a timeline to your existing data set; you should know how to use conditional formatting. Plus, it helps in showing data and understanding the data better.
Adding milestones to your timeline
Adding milestones to your timeline is an important step in making your project timeline.
Start by choosing a ready-made timeline template. Alternatively, users can make their own timeline from scratch! Changing your timeline lets you change the project timeline template to better fit your project’s needs.
It’s vital to add correct timeline data to make sure it’s easy to track your project’s progress. Making project timelines more detailed by adding various milestones can help in capturing the whole project.
Using Excel templates for timelines
It is surprising that Excel offers many templates for making timelines! Excel has you covered with a wide range of ready-made timeline templates. Users can choose to make their own timeline from scratch if none of the ready-made ones meet their specific needs.
With Excel, users can change the timeline to fit your needs. It provides easy ways to make a timeline in Microsoft Excel like adding specific dates, tasks etc.. Using a project timeline template makes the process simpler.
Benefits of using Excel templates
Excel templates make it easy to create a project timeline. You can change timeline data and include pre-set timeline graphs. These can be changed to fit your needs. Using a project timeline template can make the task of making project timelines easier.
They provide designs for creating a timeline. These designs are organized, customizable, and reusable. Even if you’re new to Excel, pre-made timeline templates make it easier to add a timeline. Excel templates are efficient and easy ways to create a timeline in Microsoft Excel.
How to use a timeline template in Excel
To create a timeline in Microsoft Excel, users first need to choose a timeline template. There are many premade timeline templates available. These are designed to make the process of making project timelines easier.

You will be surprised to know that these templates come with predefined sections and timeline data!
You can easily change the timeline to fit the project’s needs. For a more complex timeline, create your own timeline from scratch. These are some easy ways to create a project timeline using a template or add a timeline to an existing timeline graphic.
Conclusion
Creating a timeline can greatly help in managing a project’s timeline. Tools like Microsoft Excel make this process simpler.
It is great that they provide easy ways to create and add a timeline from gathered timeline data. Whether the project requires a simple or more complex timeline. It is noteworthy that project timelines should be prioritized.
Recap of creating timelines in Excel
Creating a timeline in Microsoft Excel is quite simple. We have discuss It can be done from scratch or by using a premade timeline template. The user can easily add a timeline to display project timelines. This can then be customized based on personal or project requirements.
Excel provides features to customize timeline data and layout. This is true whether it’s a basic timeline or a more complex timeline.
Excel offers various easy ways to create a timeline. This can be later turned into a timeline graphic. The project timeline template in Excel is especially useful when making project timelines. It simplifies the process and enhances productivity.
Final thoughts and additional resources
Creating a timeline greatly improves the management and visualization of a project timeline.
Microsoft Excel offers many options for customizing project’s timeline data.
Making project timelines can range from a simple graphic to a more complex timeline. This depends on your needs and expertise. Our suggestion: don’t be afraid to experiment and create your own timeline. With more practice, you’ll find easy ways to create and customize your project’s timeline!


