


Milestone charts are super handy in project management. They’re like a map that shows you the important stops along the way. This isn’t just a to-do list—it’s a snapshot of your project’s journey.
What’s a milestone chart?
In project management, you gotta keep your eyes peeled for progress. Milestone charts are your best pals for tracking project phases and big wins. They give everyone a peek at the project’s shape, so you know what’s up.
Milestone charts help you see what’s gotta be done. They light up your project goals, making sure everyone’s clued in. Keeping an eye on these milestones means you’re steering the project right.
Milestone chart basics
A milestone chart is your go-to in project management. It’s the timeline with all the key moments marked. These moments are the big deals, like wrapping up major tasks or reaching goals.
You’ll usually see this in a Gantt chart, showing the project’s start to finish. It’s great for planning, spotting issues early, and knowing what’s coming.
Premier tool for tracking project milestones
Bonsai stands out as a premier tool for tracking project milestones, especially in the dynamic business environment. Its robust features and user-friendly interface make it an ideal choice for freelancers, agencies, and small businesses looking to streamline their project management processes. It's innovative approach to project milestone tracking makes it a top choice for professionals seeking to improve their project delivery and achieve success.
Project tracking and milestone management
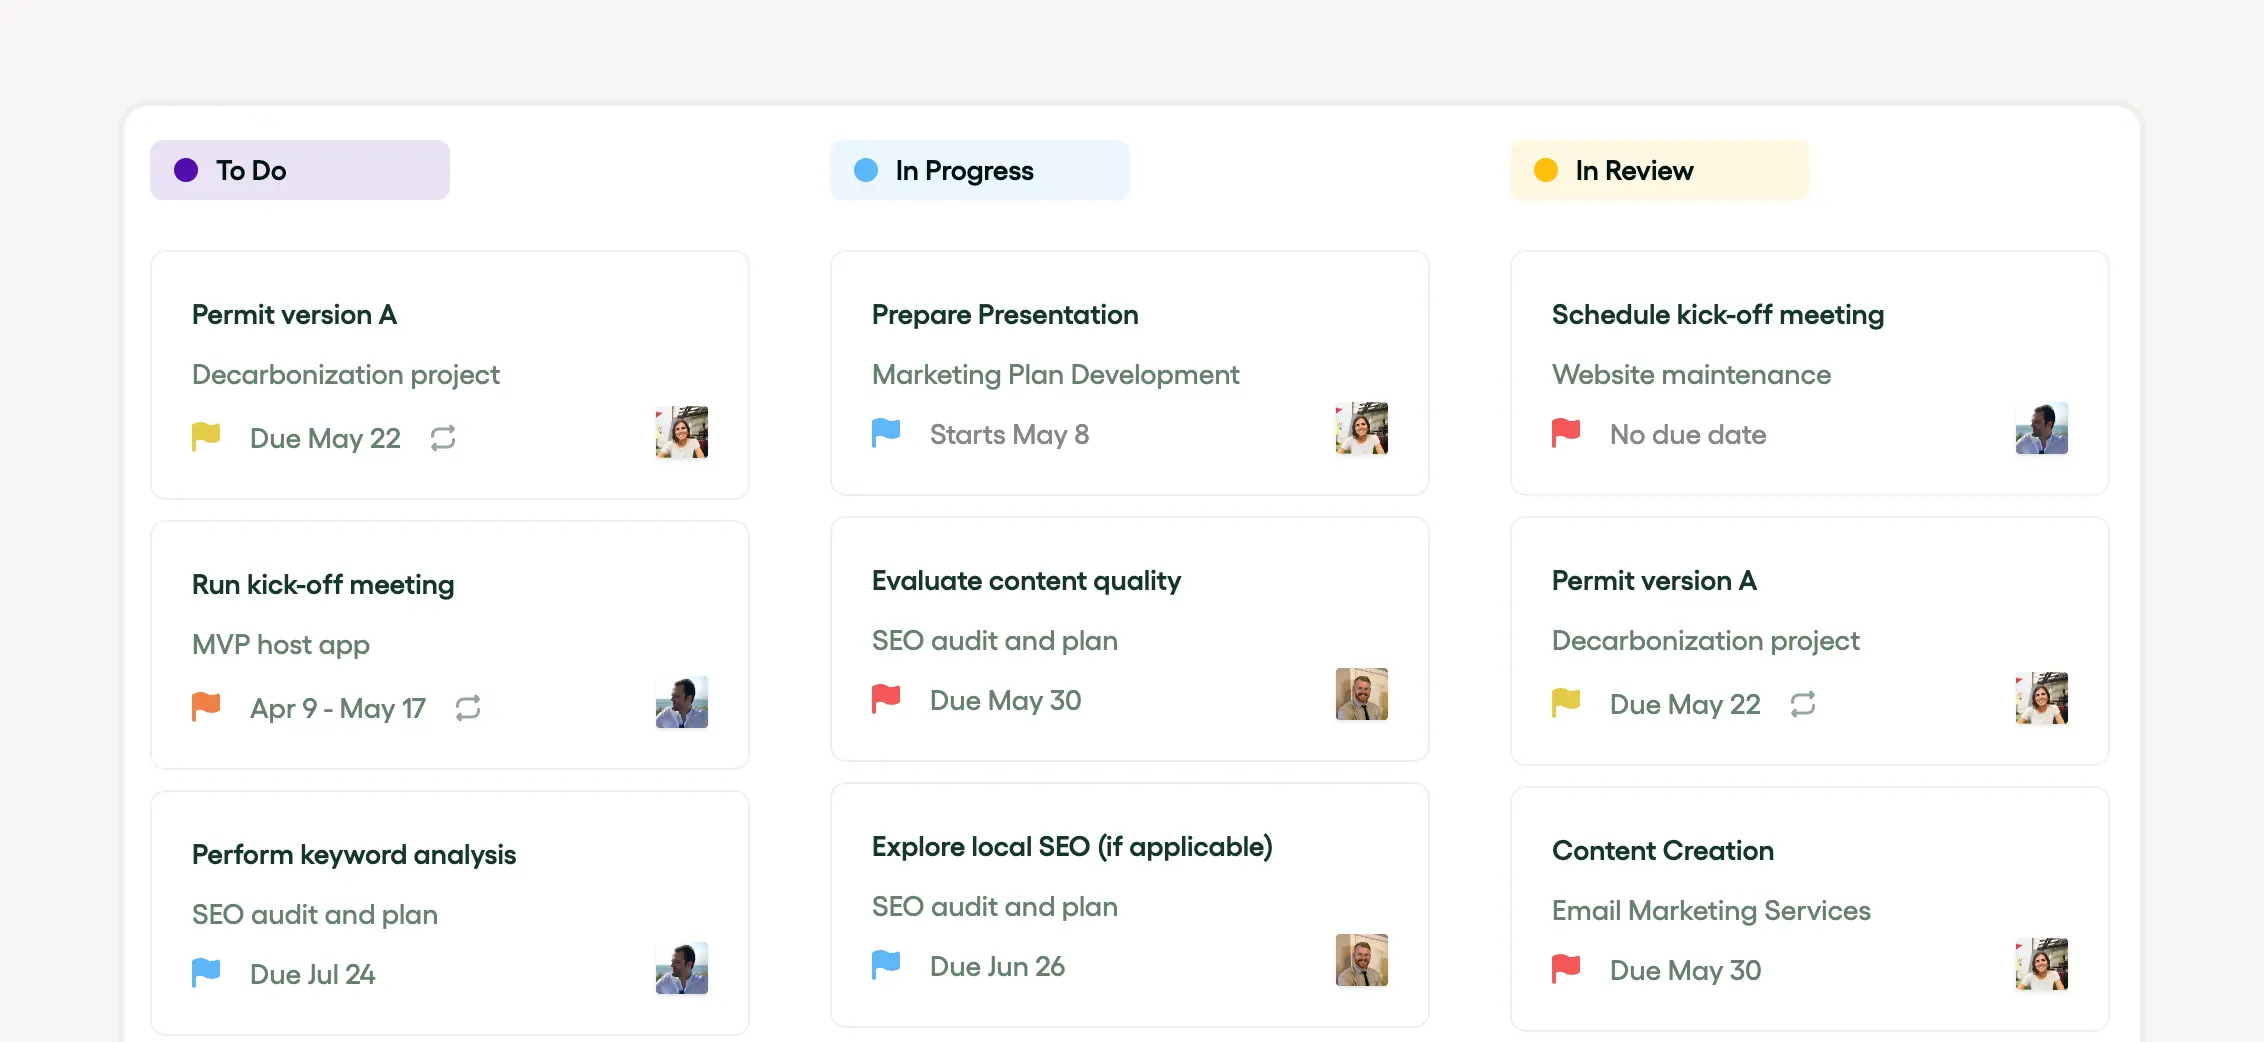
Bonsai's project tracking capabilities are designed to provide a comprehensive overview of project timelines and milestones. The tool enables users to set key project events and monitor progress against these milestones, ensuring that projects stay on track.
Customizable templates and tools
The platform offers customizable templates and tools that cater to the specific needs of different projects. This flexibility allows users to create a personalized tracking experience that aligns with their project goals and objectives.
Resource allocation and budget management
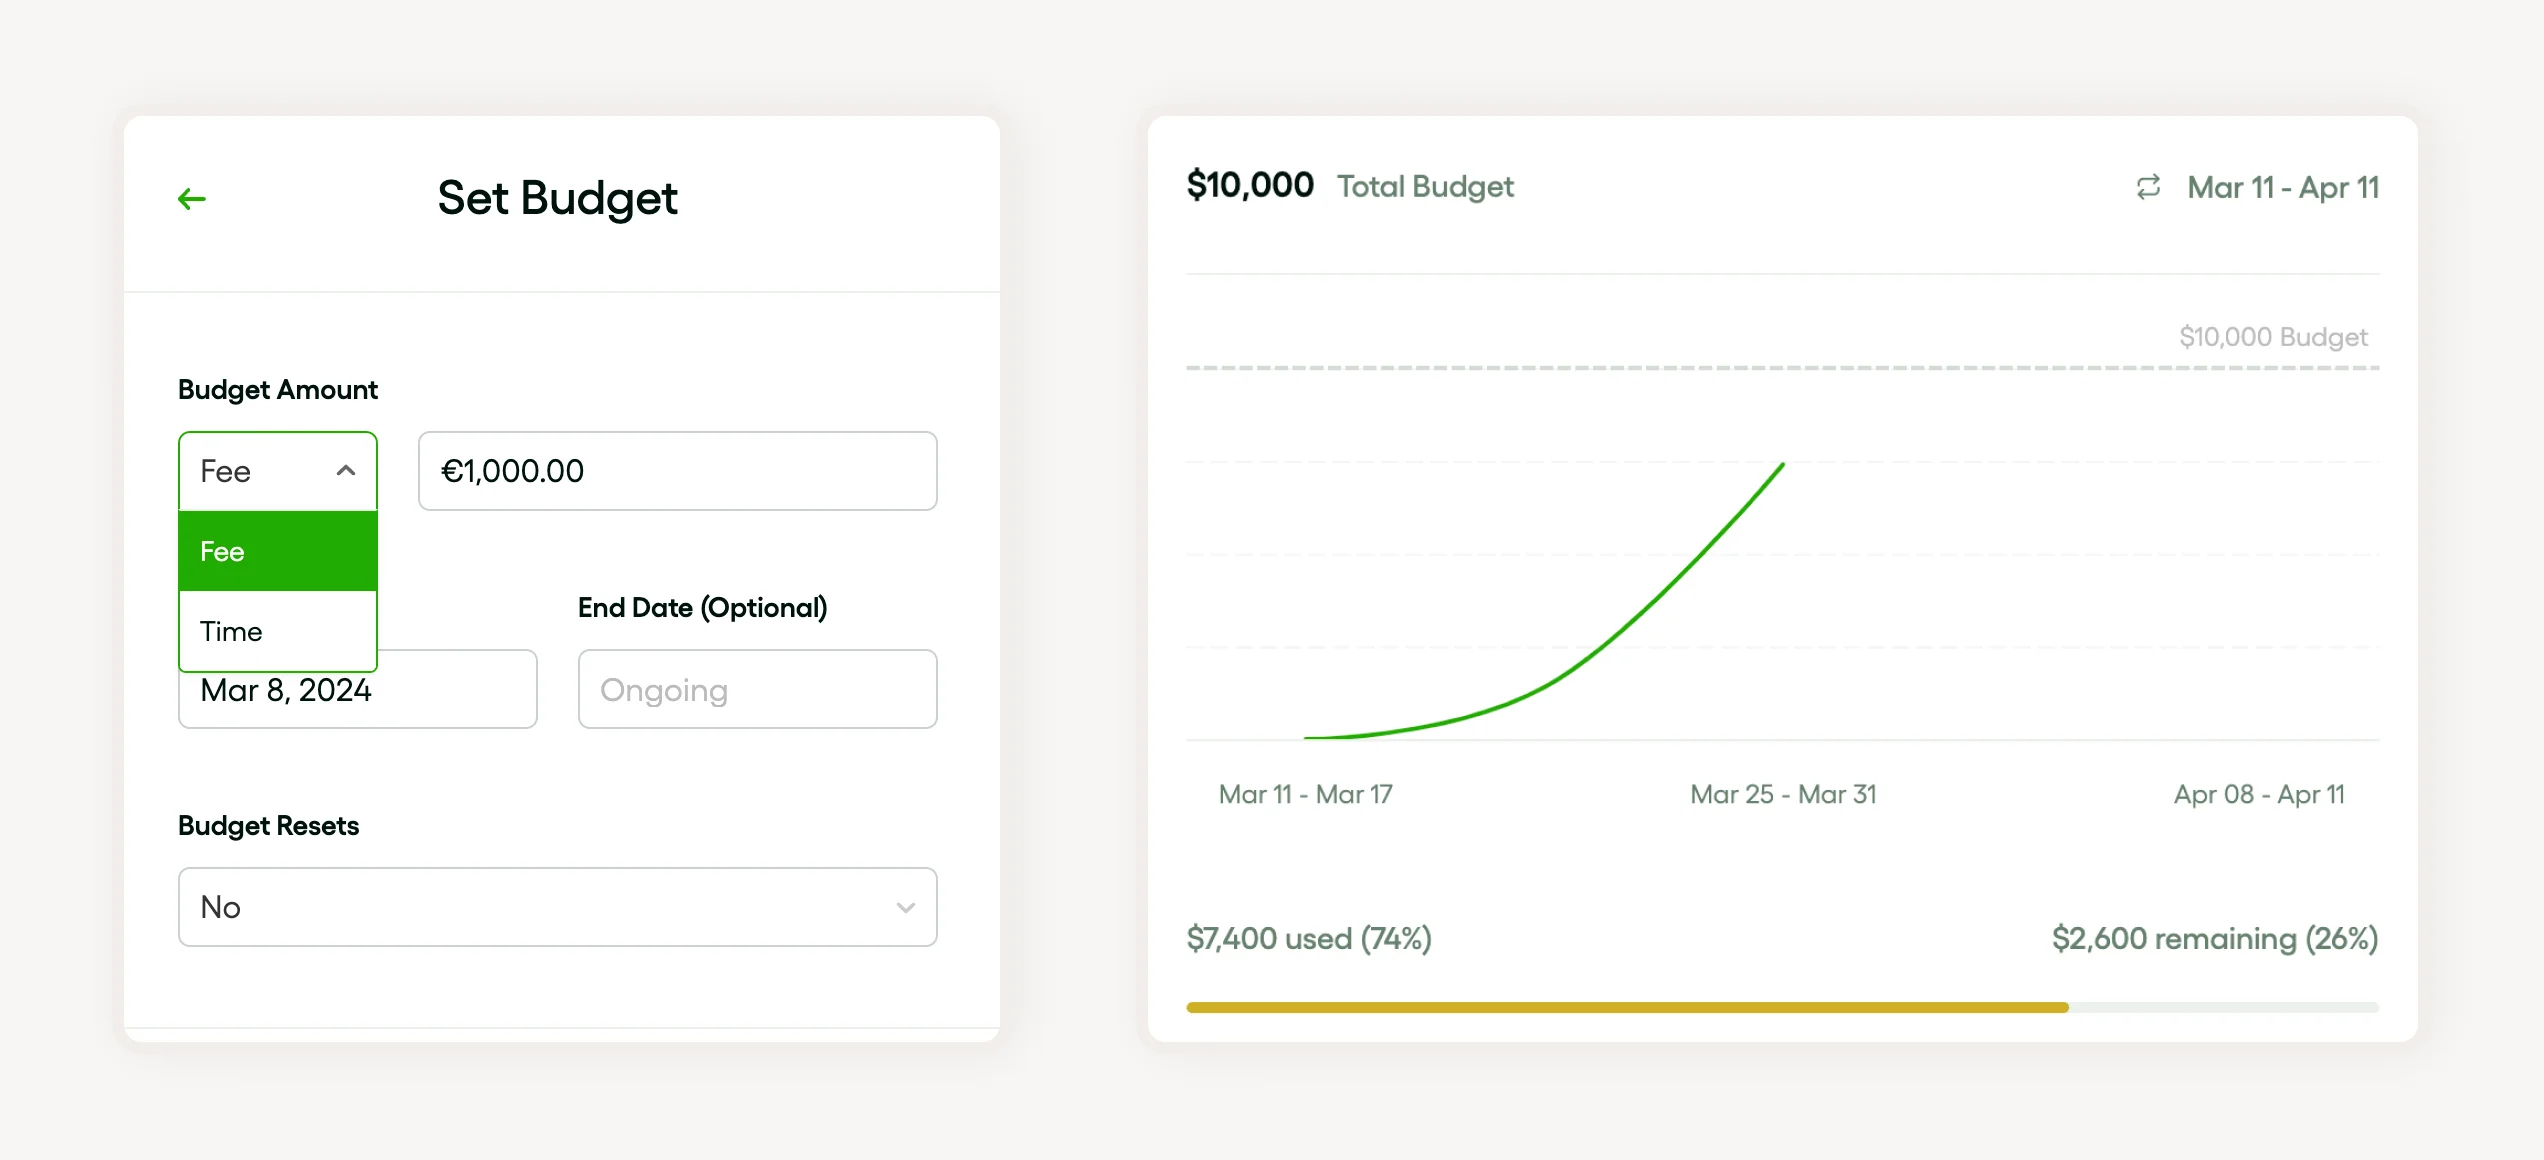
Bonsai also excels in resource allocation and budget management, which are crucial for maintaining project efficiency. The software's budget tracking features help users manage project finances, providing insights into spending and helping to avoid budget overruns.
User Experience and Integration
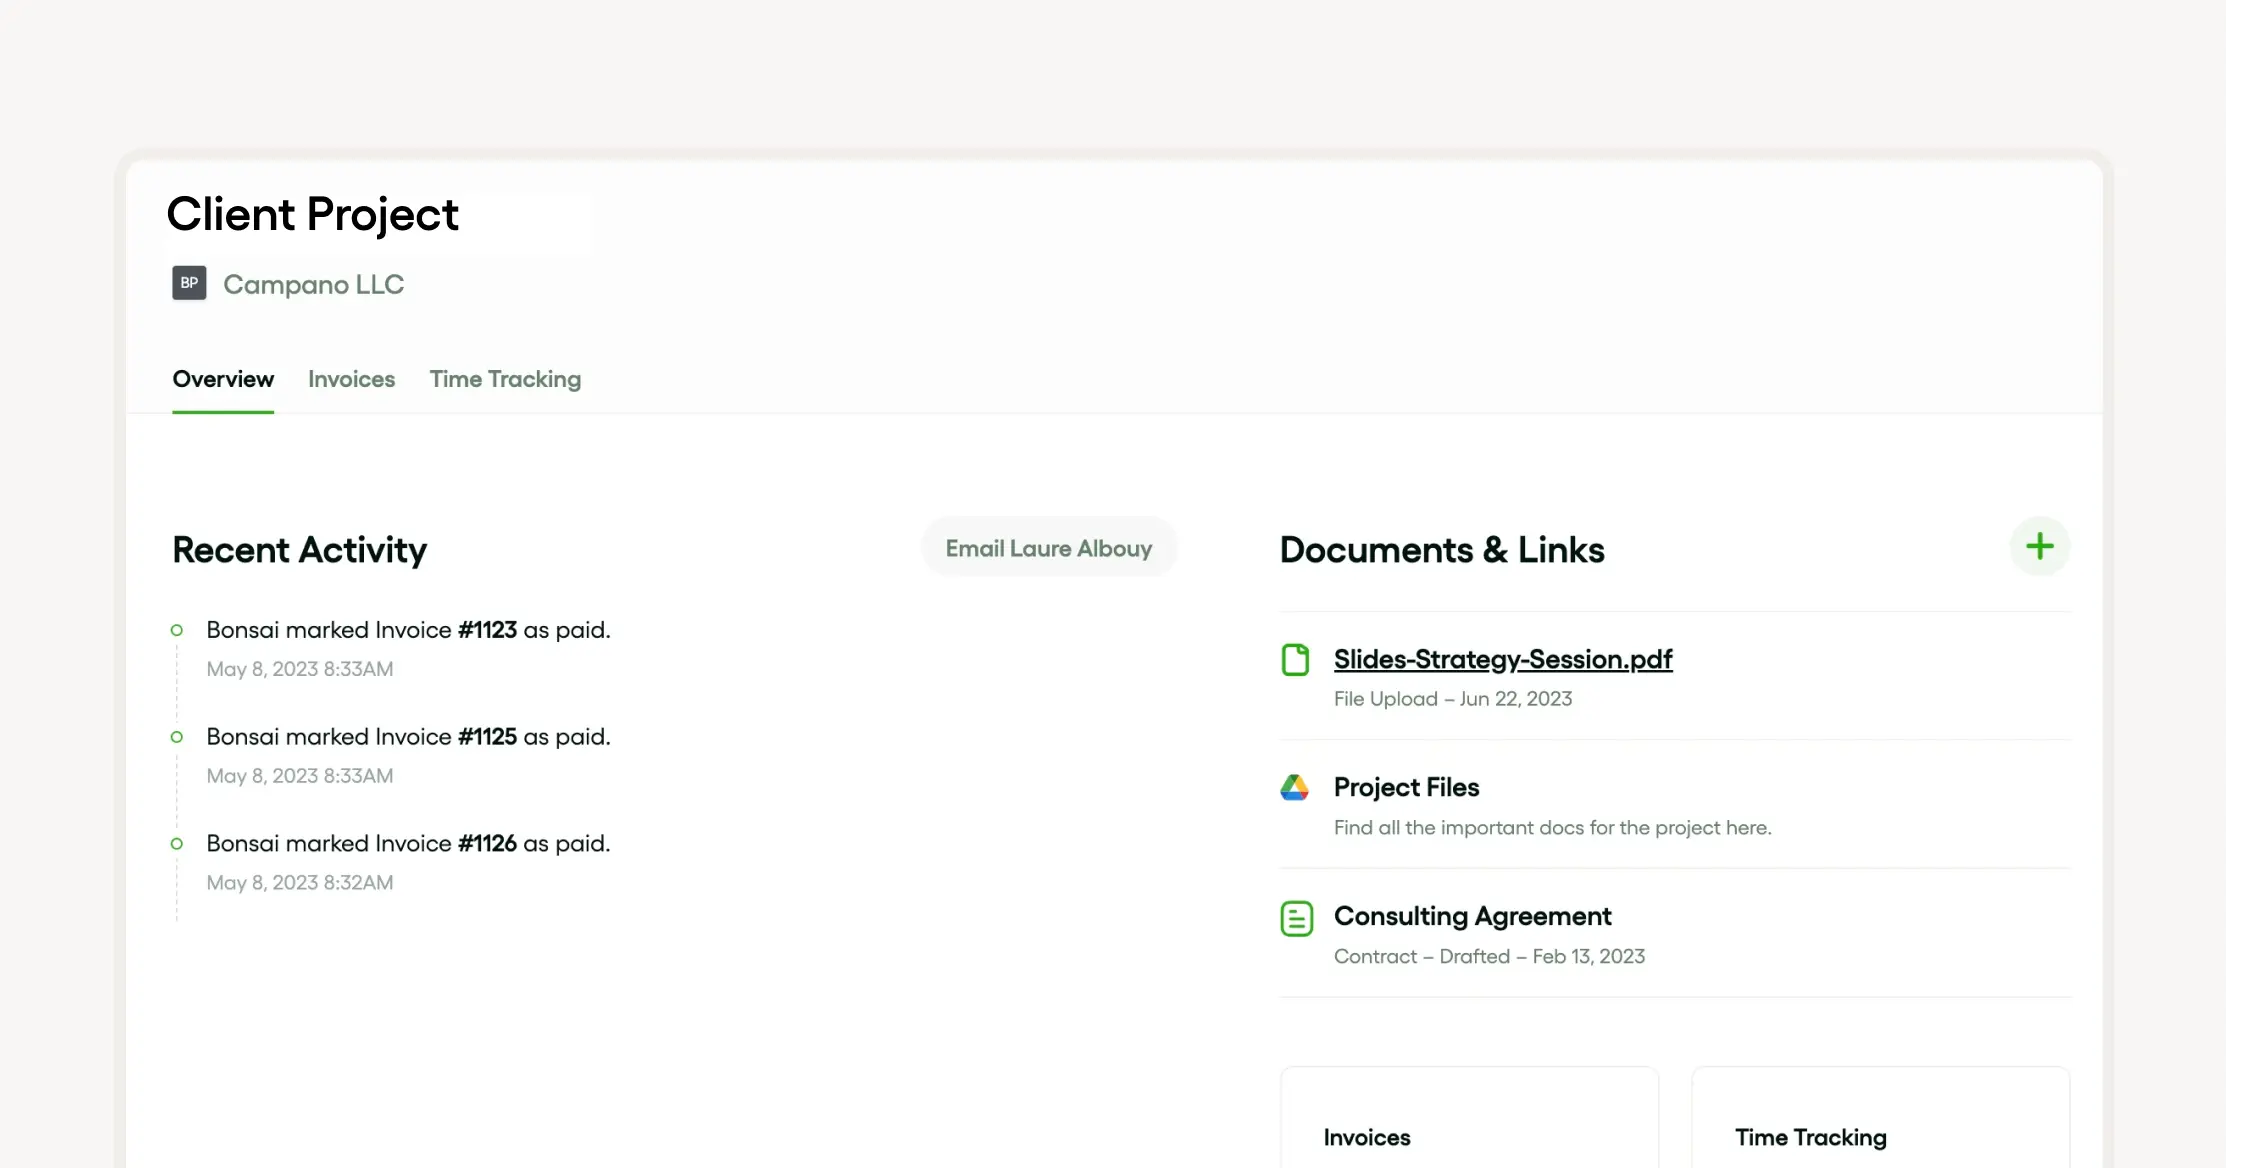
With its intuitive design, Bonsai ensures a seamless user experience. The integration of time tracking and invoicing within the same platform further enhances its utility, making it a comprehensive solution for project management.
Support and Community
Bonsai is supported by a strong community, offering resources and assistance to users. This support is invaluable for troubleshooting issues and optimizing the use of the tool for milestone tracking.
Milestone charts through time
Milestone charts and project management go way back. In the late 1800s, Henry Gantt’s chart was a big hit for keeping projects on track.
Gantt’s brainwave included project milestones—those key points that make a difference. Milestone charts have come a long way, now they’re not just about deadlines but also clear communication.
Milestone chart parts
A milestone chart is a big deal in project management. It points out the must-dos and the big moments that show you’re moving forward. These include hitting targets, finishing stages, or nailing goals.
What makes up a milestone chart?
A milestone chart is vital for keeping projects in check. It’s got bits that show you how things are going. The main bits are the milestones—those major events or steps in your project.
There are other parts too, like what you’re aiming to make and any hiccups that might pop up. Don’t forget the stakeholders—the people invested in the project’s outcome. They all play a role in making sure the project hits its marks.
Reading a milestone chart
In project management, a milestone chart lays out the whole life of your project. It’s got all the tasks, the timeline, and the key points you need to hit.
This tool shows you how the project’s doing, letting folks keep tabs on goals and spot any tricky bits. It also points out parts of the project that might need a bit more elbow grease.
The importance of milestone charts in project management
Milestone charts are vital in project management as they visually organize project tasks along the timeline, clearly showing how things are progressing. They help identify key milestones, which makes planning a whole lot easier. These milestones pop up at different points in the project's life and act as checkpoints for stakeholders to see if things are on track.
By using a tool like a Gantt chart, you can spot possible issues before they become real problems, and come up with plans to deal with them. This means better control over the project outcome and making sure deliverables are met well within deadlines.
Role of milestone charts in planning
Milestone charts play a big role in project management, especially in planning. They clearly show the project's key moments, representing major events or goals throughout the project's life. This clarity helps stakeholders get the big picture at a glance.
The charts are also great for keeping an eye on how things are moving, highlighting what’s done and what’s left to do. Spotting potential problems early is key, allowing for effective solutions. This makes a milestone chart an invaluable tool for hitting project goals and making the most out of project outcomes.
How milestone charts facilitate communication
Milestone charts are key in project management. They serve as a straightforward timeline tool, visually laying out the project timeline and key milestones, thus making project progress clear to stakeholders. This boosts transparency, enhances communication, and aids in project planning.
By breaking down the project lifecycle into manageable tasks, they mark the start and end of project phases and help keep teams focused on project goals. By spotlighting deliverables and issues, they make it easier to track task completion and potential roadblocks, alerting teams early and ensuring a smoother project outcome.
Overall, milestone charts act like a simplified Gantt chart and an easy-to-grasp communication tool that promotes clarity and collaboration within the team, aiding in the successful achievement of project objectives.
Milestone charts and risk management
Project management requires efficient planning and tracking of project milestones, helping to clearly define the project timeline and tasks. Tools such as Gantt Chart often play a crucial role in simplifying the project lifecycle, facilitating easy comprehension of the project progress and upcoming deliverables for project stakeholders.
Risk Management is a crucial aspect, involving identification and assessment of potential project issues. This proactive approach enables prompt responses to challenges, thus ensuring project goals are accomplished as per the planned timeline. These processes within project phases contribute significantly to the overall project outcome.
Benefits of using milestone charts

Milestone charts play a crucial role in project management. They provide a visual representation of key project milestones, offering a clear, concise view of the project timeline and progress. Additionally, milestone charts also aid in project planning, allowing project stakeholders to note the sequence of project tasks and align them with the project deliverables effectively during different project phases.
These charts also act as a project lifecycle tracking tool, helping monitor and address project issues promptly. Thus, a milestone chart ultimately facilitates achieving project goals smoothly and timely, improving the project outcome. Compared to Gantt charts, milestone charts provide a simplified view, making them easier to understand and follow.
Enhanced project visibility
Effective project management significantly enhances project visibility. It allows project stakeholders to keep a close and real-time eye on the project progress, from initiating stages to project outcome. Key tools like the Gantt chart, which outlines project phases and project milestones, grant even more clarity.
Moreover, having a firm grasp on project tasks and project deliverables is crucial in ensuring project goals are met. A detailed project timeline using a robust timeline tool can provide a bird's eye view of the project lifecycle and readily alert the team about potential project issues.
Improved team collaboration
Improved team collaboration is a significant outcome of effective project management. Utilizing a timeline tool helps in defining project tasks, aligning project milestones, and allowing all project stakeholders to visualize the project timeline, thereby promoting transparency and shared understanding.
Further, Gantt chart applications can greatly aid in project planning by representing the project phases and project lifecycle. This leads to streamlined project progress tracking and better identification and resolution of project issues, thereby enhancing project outcomes and delivering on project goals.
Effective time management
Effective time management is crucial in project management as it directly impacts project deliverables and outcomes. This involves diligent project planning, setting clear project milestones, and tracking project progress regularly.
A well-mapped project timeline - possibly visualized through a Gantt chart - aids in strategically navigating through the project lifecycle. This timeline tool ensures all project tasks are completed within the prescribed project phases.
Lastly, effective communication with project stakeholders also aids in early detection of any possible project issues and maintaining harmony amongst the team.
Creating a milestone chart: a step-by-step guide
Creating a milestone chart is a key move in managing your projects. Start by pinpointing the project milestones—these are the big events or phases that show you're moving toward your goals. These should tie directly to the deliverables and tasks of your project.
Identifying key milestones
Nailing your project milestones is essential for solid project management. These key points mark important tasks in your timeline and show how your project is coming along. A Gantt chart is handy here, as it visually places these milestones within the overall project cycle.
These milestones are not just markers; they guide your project planning and provide checkpoints towards your end goals. Plus, they're great for keeping everyone in the loop about the project's pace and direction, and for spotting any possible snags early.
Setting timelines and deadlines
In project management, getting your timelines and deadlines right is crucial for making sure everything runs smoothly. You'll want to lay out your project timeline clearly, using tools like Gantt charts to keep an eye on phases and milestones. This step is vital to make sure all your deliverables are met on time.
Project folks depend on these timelines to watch how the project unfolds, set goals, and foresee the outcomes. Timelines are also key in catching issues early, making them a must-have in your project management toolkit.
Visualizing the milestone chart

Tracking your project's milestones and overall timeline is a big deal in project management. You usually use a Gantt chart for this. It's a top-notch tool that clearly shows your project's lifecycle.
Regular updates on the Gantt chart help everyone stay up-to-date on the project. It's good for detailing phases, setting out goals, spotting potential issues, and guessing how things will turn out.
Best practices for using milestone charts
Milestone charts are super important in project management. They lay out the project timeline visually and track your progress with a Gantt chart. For the best results, always include your project goals and tasks, note down their related deliverables, and make sure they fit with the project's flow.
In your planning, set clear, doable milestones that really show progress. Use a timeline tool to map them out relative to each other. This helps everyone involved easily keep tabs on progress, identify any problems, and grasp the expected results.
Keeping milestone charts simple and clear
In project management, the clarity of your milestone charts is key. They should clearly show the sequence of project tasks and how they unfold. Keeping these charts simple helps everyone involved understand them without any fuss.
Using a Gantt chart or similar tools, make sure the view is clean and focuses on the main deliverables and progress. It's crucial to keep these tools simple to avoid any mix-ups or missed issues.
Regularly updating the milestone chart
Keeping your milestone chart up-to-date is essential in project management. This chart, often a Gantt chart, lays out the key tasks, milestones, and deliverables along a timeline, showing the whole lifecycle of the project. Regular updates give a live look at how the project phases are going and if the goals are being met.
These updates are also great for spotting potential issues early on. Staying on top of the timeline helps adjust your plans to handle risks and ensure you get the outcomes you want. Keeping your timeline tool current is crucial for steering your project to success.
Top software tools for creating milestone charts
When you're in the thick of project management, you really need a milestone chart. It's perfect for showing off important stages, deadlines, and goals. Below, you'll find some top-notch software that makes creating milestone charts a breeze:
Bonsai
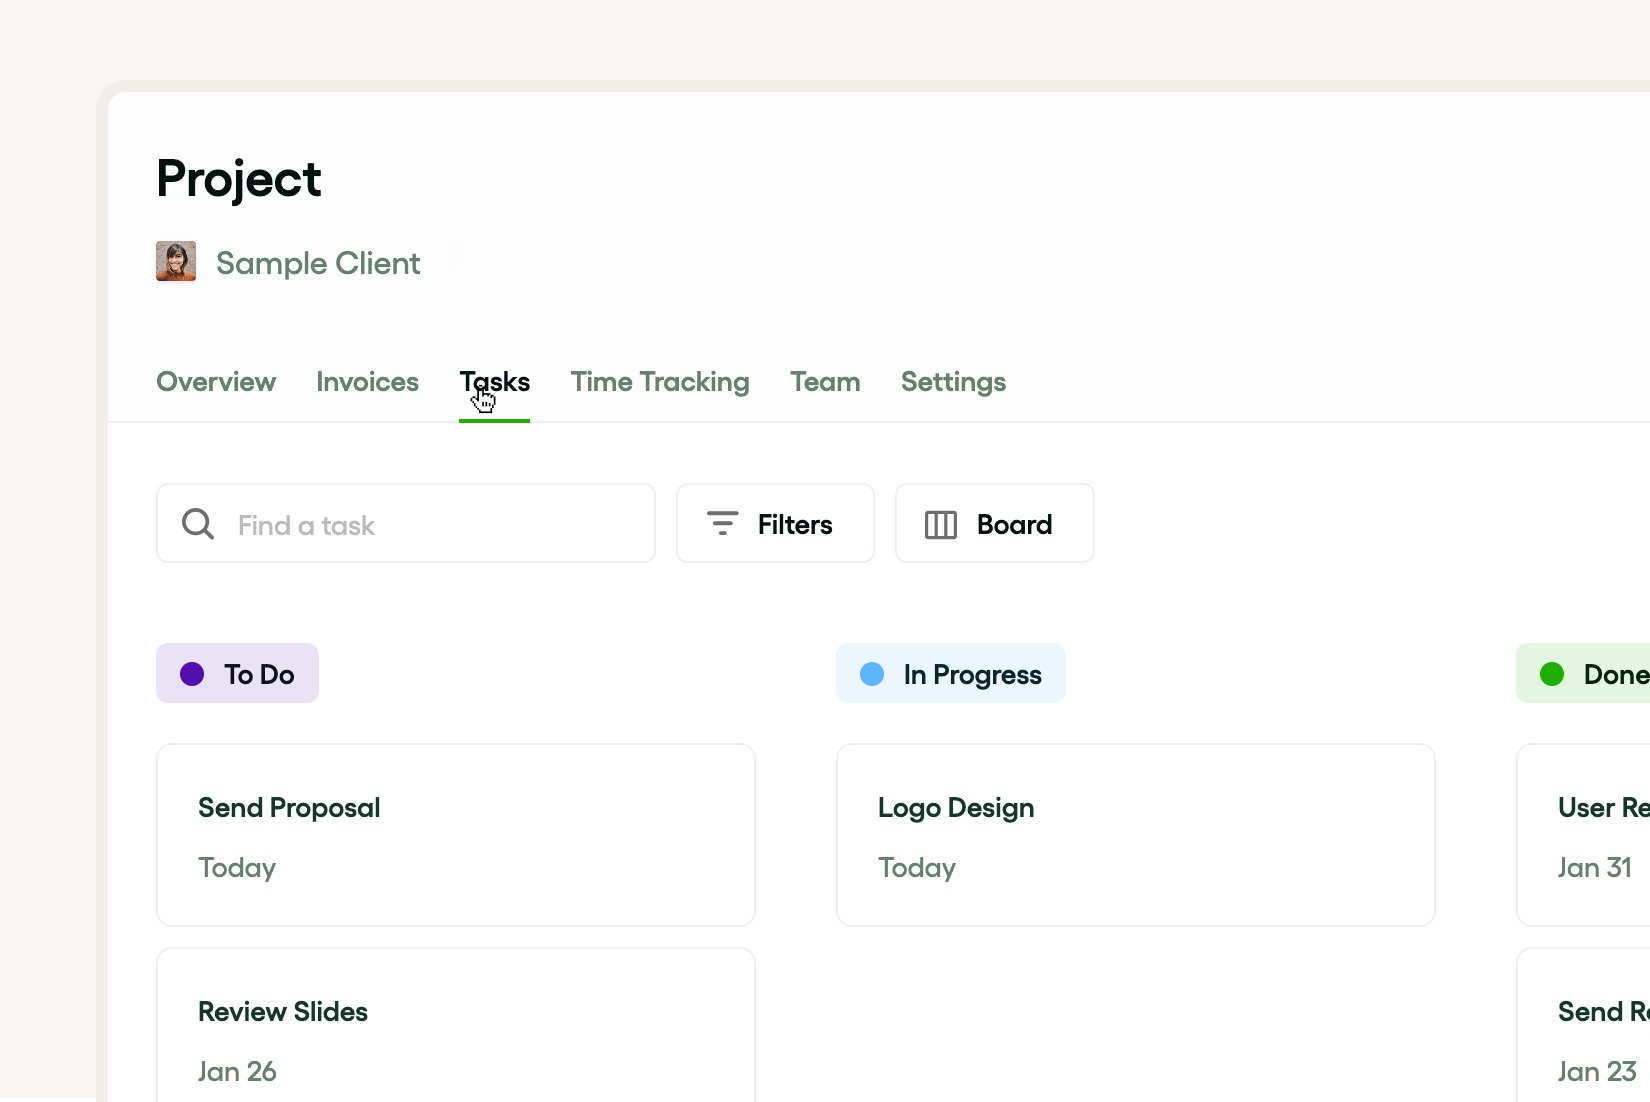
Bonsai is a comprehensive business management software that offers a suite of tools for project management, client management, and financial management. Using Bonsai software offers numerous benefits for simplifying business operations and managing tasks effectively. Creating milestone charts in Bonsai involves selecting a chart type, using a template, and customizing it with project details.
Microsoft Project
Microsoft Project is a rockstar in project management. It lets you tackle project planning like a pro, with tools to set up tasks, milestones, and keep an eye on your whole project from start to finish. It's got this timeline tool that's a real help in visualizing how your project is doing.
Besides that, it's great for nailing down project goals, roping in stakeholders, and spotting any issues that pop up. And if you love Gantt charts, Microsoft Project makes it super easy to set them up and keep track of everything.
Smartsheet
Smartsheet really gets project management right, making it easier to handle planning and keeping track of everything. It lets you set milestones, map out timelines, and spell out what needs to get done, all while keeping the project's big picture in mind.
What stands out is its Gantt chart feature. It's a visual tool that lays out your project's phases and goals clearly. Plus, it's a champ at enabling real-time collaboration, so everyone involved can stay on the same page and tackle issues as they come.
Whether your team is big or small, Smartsheet gives you the tools to plan thoroughly, track diligently, and hit your project targets.
Asana
Asana is a name you hear a lot in project management for its solid track record with tasks, milestones, and timelines. It's got this Gantt chart setup that's ace for visually planning your project, showing you where things stand at a glance.
The platform is adaptable, fitting just right with your project's needs. It sets out clear goals through various phases, keeps everyone informed, and jumps on issues fast, wrapping up everything you need for managing projects effectively.
Conclusion: maximizing the potential of milestone charts
Getting the most out of milestone charts can really smooth out your project management process. This tool is key for keeping track of progress, making sure tasks line up with the timeline. It also helps in setting clear goals, syncing up phases smoothly, and chatting effectively with everyone involved.
Whether you're plotting milestones or defining deliverables, a solid milestone chart or Gantt chart gives you a visual breakdown of your project. It makes spotting and fixing problems quick, boosting the overall project results.
